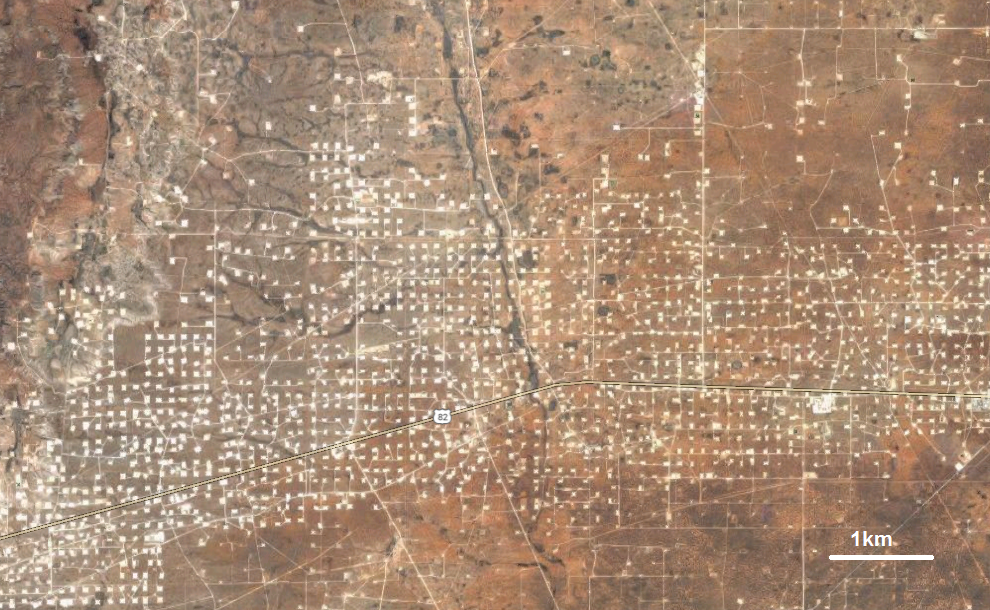
The Year Dot: a plethora of oil wells exploiting the Permian Basin populate Eddy County, New Mexico. Google Earth 2017
The oilfield minerals industry is emerging from the doldrums of 2015/16 with renewed vigour and expectations of rising demand during the next two years at least.
Increased E&P spending and drilling activity in the USA has rejuvenated the market for oilfield minerals such as barite, bentonite, calcium carbonate and proppants.
Outside North America, recovery is less pronounced, with the exception of Brazil and parts of the Middle East (see Oilfield minerals outlook for the Middle East).
IMFORMED will be bringing together the world’s leading players of the global oilfield minerals supply chain to listen to a panel of expert speakers at Oilfield Minerals & Markets Forum Houston 2017, 21-23 May, The Houstonian Hotel – very attractive Early Bird Rates available only until 10 April 2017.
For all the latest trends, developments, & invaluable networking for the oilfield minerals market
EARLY BIRD RATE SAVING $300 ENDS 10 APRIL 2017

IEA calls for global investment
According to the International Energy Agency’s (IEA) latest forecast released earlier this month, unless new projects are approved soon global oil supply will struggle to keep pace with demand after 2020, risking a sharp increase in prices.
Supply growth in oil is expected to “slow considerably” after 2020. Demand and supply trends outlined in the IEA’s Oil 2017, published 6 March, indicate a tight global oil market, with spare production capacity in 2022 falling to a 14-year low.
Oil demand will rise in the next five years, passing the symbolic 100 million barrels per day (mb/d) threshold in 2019 and reaching about 104 mb/d by 2022.
Chief among the main contributing factors has been the record two-year investment slump of 2015 and 2016. While investments in US shale plays are emerging strongly, early indications of global spending for 2017 are not encouraging to the IEA.
Dr Fatih Birol, the IEA’s Executive Director, commented: “We are witnessing the start of a second wave of US supply growth, and its size will depend on where prices go. But this is no time for complacency. We don’t see a peak in oil demand any time soon. And unless investments globally rebound sharply, a new period of price volatility looms on the horizon.”
Speaking at Oilfield Minerals & Markets Forum Houston 2017
Outlook for oil and gas supply and demand
Uday Turaga, CEO, ADI Analytics LLC, USA
Boom, bust and beyond: oilfield chemicals & minerals
Ray Will, Director, IHS Markit Specialty and Inorganic Chemical Consulting, USA
Essential minerals for drilling fluids
JJ Miller, Snr. Global Product Manager, Baroid Global Technical Services, Halliburton, USA
Rise in US drilling activity
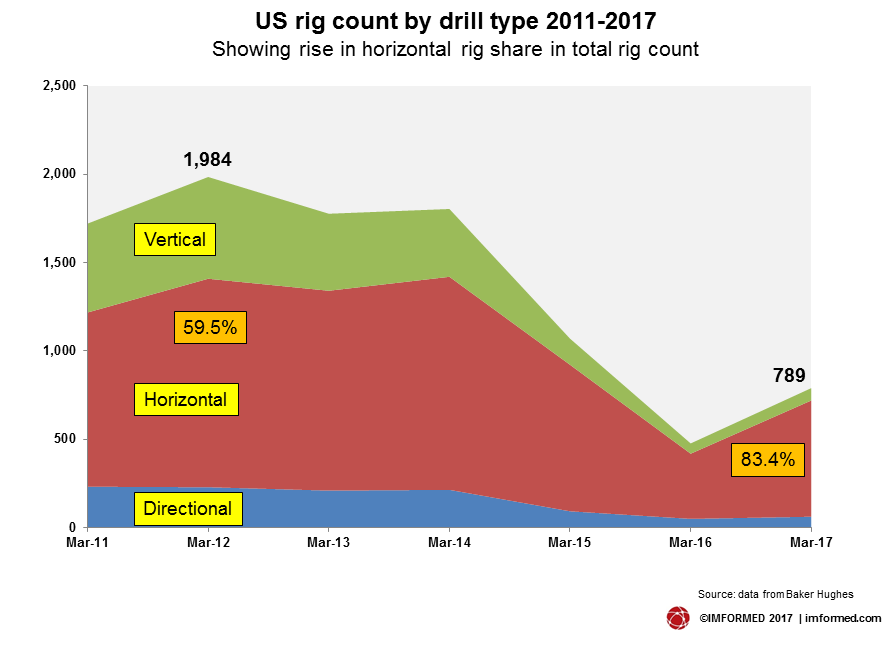
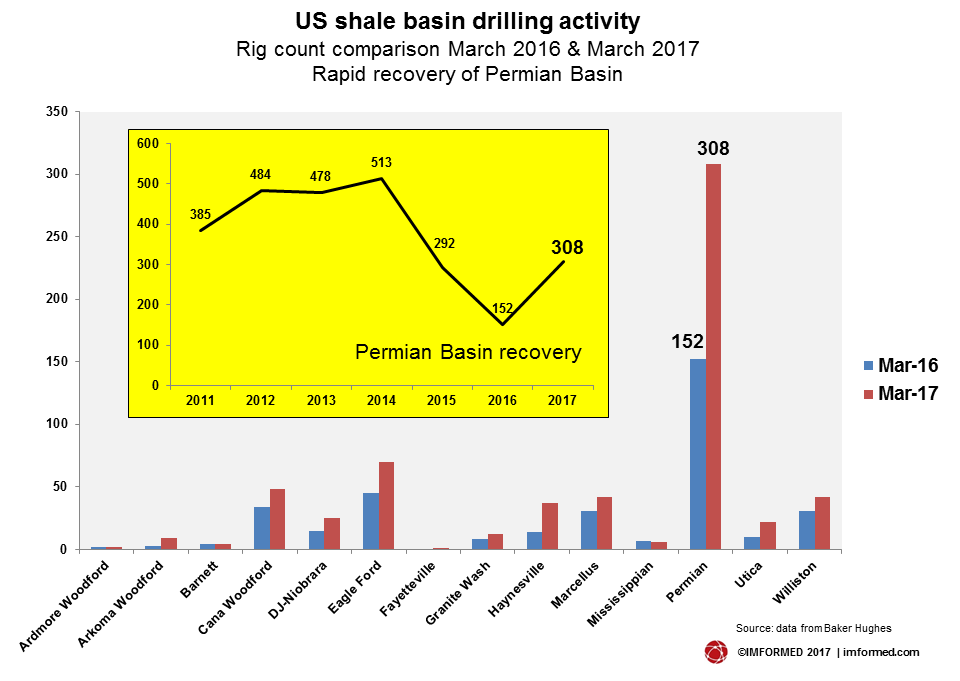
US drilling activity is continuing to rise. According to the Baker Hughes weekly rig count the total number of rigs active in the USA grew by 21 on 17 March, with land rigs up by 22. This brings the total rigs active in the USA to 789, up from 768 the previous week and 476 last year.
The resurgence in fracturing treatments is reflected in the vast majority of added rigs drilling horizontal wells, a trend well demonstrated overall with over 80% of all US rigs drilling horizontal wells (see chart).
A recent survey from Barclays echoes the IEA’s concerns on global spending but highlights a different case for North America. While the overall recovery in the global oil and gas industry remains slow, capital spending in North America is expected to rise 27% in 2017.
This is expected to see major US exploration and production companies quickly raise spending on drilling and completing wells, while spending by international companies elsewhere will be quite slow.
Barclays concluded that US shale oil producers, which were the fastest to react by cutting activity when crude prices began to tumble in 2014, are also likely to be the quickest to recover. Certainly this seems to be playing out in southern USA, where frac sand demand is soaring (see below).
The IEA recognises the role to be played by the USA as the largest contributor to new oil supplies. US light tight oil (LTO) production is expected to make a strong comeback and grow by 1.4 mb/d by 2022 if prices can be maintained around US$60/bbl. Expectations for US LTO are higher than last year’s forecast thanks to impressive productivity gains.
The US responds more rapidly to price signals than other producers. If prices climb to US$80/b, US LTO production could grow by 3 mb/d in five years. Alternatively, if prices are at US$50/b, it could decline from the early 2020s.
Speaking at Oilfield Minerals & Markets Forum Houston 2017
World barite supply and demand
Peter Huxtable, Director, The Barytes Association,
North American barite consumption trends and outlook
John Newcaster, Director Southwest Region, The Cumberland Group Inc., USA
Mexican barite deposits and operations
Ken Santini, Santini Associates Inc., USA
Chinese barite production and outlook
Liao Ying, Managing Director, Baribright International Inc., China
India’s barite resources, production, and trade
Venkaiah Chowdary, Vice Chairman & Managing Director, APMDC, India
In its March Short-Term Energy Outlook, the US Energy Information Agency (EIA) forecast US crude oil production to average 9.2 million b/d in 2017 and 9.7 million b/d in 2018 (over an estimated 8.9 million b/d in 2016.
The EIA forecasts Brent crude oil prices to average $55/b in 2017 and $57/b in 2018. West Texas Intermediate (WTI) crude oil prices are expected to average about $1/b less than Brent prices in the forecast.
In mid-March US oil prices dropped below $50 a barrel for the first time in 2017 as near-record US stockpiles and rising output have impinged on the production reductions by OPEC.
Whether these cuts are to be continued will be decided by OPEC in May, but signs in the marketplace suggest there is little faith in this happening. Indeed, it will an interesting decision making process all round for OPEC, since it appears that the cartel may have underestimated the resilience of the US shale sector when it decided to curtail oil supply back in November 2016.
Break even prices in the leading US shale areas are now <$40/b: eg. $36-39/b in the Eagle Ford, and $36/b in the Permian (compared to $71/b in 2014!). So shale gas production recovery in the USA is set to continue unless prices drop very dramatically towards the $30/b mark. Can OPEC afford to maintain losing market share to US producers by keeping a lid on production?
In any case, the emerging boom in shale gas play drilling activity has been utterly welcomed by the proppant supply sector, although it’s all frac sand – ceramic proppants seem to be enjoying less of the action.
Proppant surge – Texas stampede for brown sand
The US frac sand industry is preparing for a boom year as intense activity is taking place using more frac stages and longer laterals mainly in the Permian, Eagle Ford, and Bakken shale plays.
Above all, the Permian in West Texas and New Mexico is the lead target with wells frequently pumping a full-unit train of around 100 railcars of sand during completions.
Talking to Mark Zdunczyk, consulting geologist specialising in frac sand, at last month’s 2017 SME Annual Meeting in Denver, he said: “It’s almost impossible to find a drill rig
The critical factor here is that frac sand users in southern USA have apparently got over their somewhat picky attitude that has prevailed until now in wishing only to use the bright, white frac sands of the Mid-West, ie. from Wisconsin and Illinois.
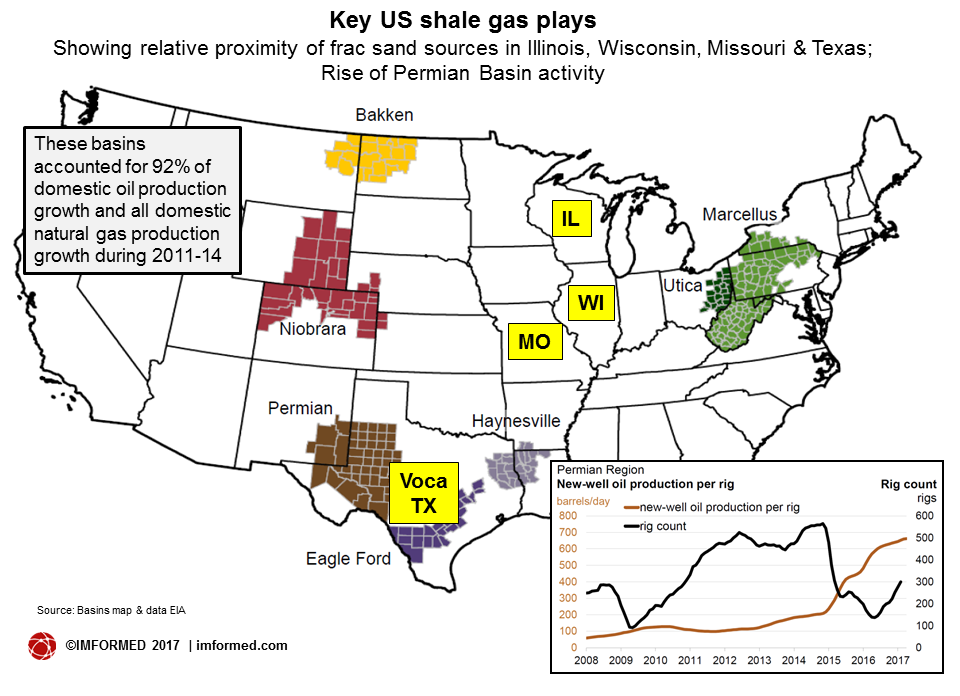
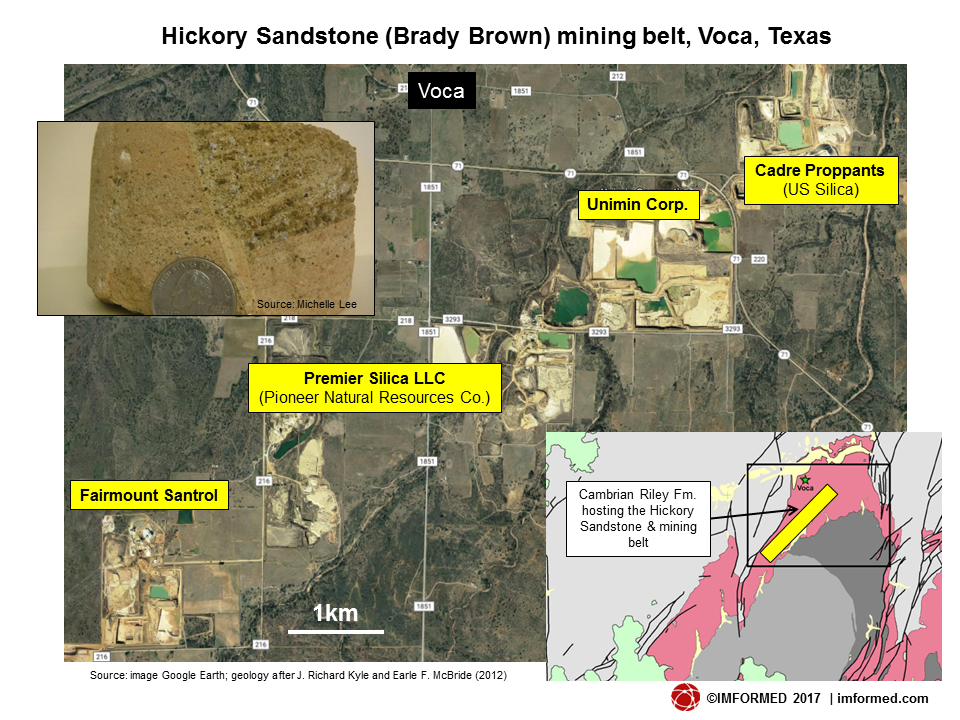
The likes of the discoloured sands, such as the Brady Brown (Cambrian Hickory Sandstone) of Texas, which are totally on spec regarding crush resistance, are now in high demand as consumers want a secure frac sand source close to their active wells rather than pay the considerable freight rates to bring down large volumes of “cleaner looking” sand from elsewhere – yet again underlining the critical logistics factor in this market (see US shale plays map). One might ask why should colour have mattered so much to frac sand selection?
This trend has placed great pressure on regional suppliers to Texas, considerably upped frac sand deposit exploration and evaluation in the area (especially around Voca, central Texas, location of the Hickory Sandstone – see picture and map), and no doubt concerned some investors in Mid-West frac sand projects.
Only this month, major US frac sand producer Hi-Crush Partners LP concluded its acquisition of Permian Basin Sand Company LLC, located just east of Voca, with a 1,226 acre frac sand reserve hosting >55m tons of 100 mesh frac sand, the hot grade of choice at present.
To further bolster its Texan resources, Hi-Crush has also purchased the former recreational Dunes park at Kermit, in west Texas, and is preparing the 1,300-acre site for frac sand mining with construction of a 3m tpa plant.
Speaking at Oilfield Minerals & Markets Forum Houston 2017
Frac sand supply chain: challenges and opportunities
Taylor Robinson, President, PLG Consulting, USA
The frac sand industry new normal
Joel Schneyer, Managing Director , Minerals Capital & Advisory Practice, Headwaters MB,
Why silica sand successfully substitutes bauxite in some shale fracs
Pickard Trepess, Managing Director, FRAC PT FZE, UAE
Screening the facts: the 40/70 & 100 mesh frac sand boom and its impact on silica sand supply and markets
David Frattaroli, Executive Advisor, USA
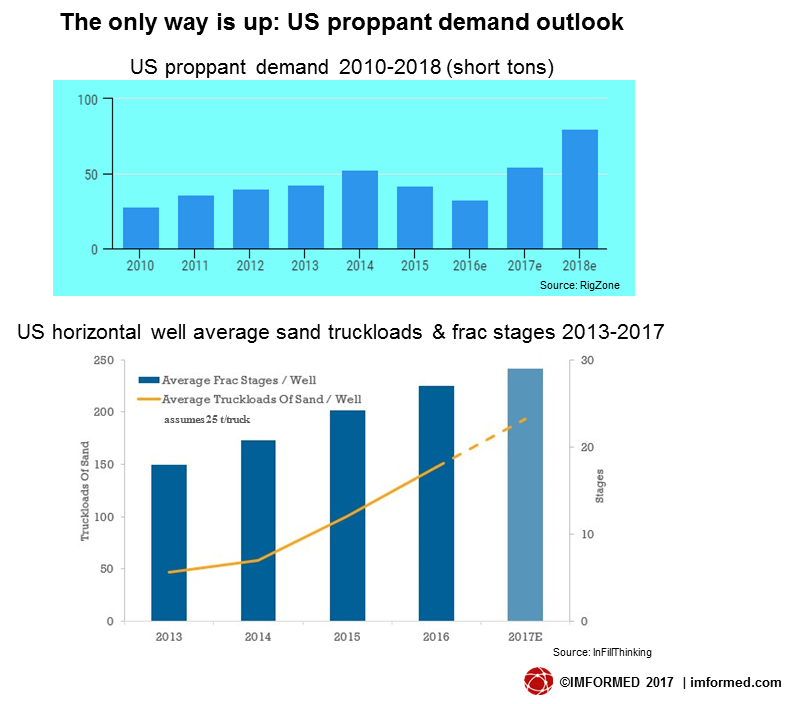
The only way is up – US proppant demand outlook
Whether supplying Northern White or Brady Brown, it would seem most US frac sand producers will be looking forward to the next two years with relish.
Analysts Raymond James has forecast that while the average 2017 US rig count will be 60% below activity levels during 2014, domestic proppant demand should exceed 2014 levels with US sand volumes to nearly double to all-time highs in 2017 at 55m s.tons, and grow another 45% or more in 2018 to a potential 80m s.tons (see chart).
The increased demand is anticipated to push frac sand prices up by maybe 60%, hitting the $40/ton range over the next 18 months. Sand costs are about $25/ton at present, and reached $70/ton prior to the downturn.
Key to proppant demand is the “proppant intensity” or proppant loading, ie. pounds/lateral foot (lb/ft), which has increased by more than 50% on average since the start of 2014.
There has been a major shift to higher proppant loading from around 700 lb/ft to around 1,400 lb/ft, and many leading operators are testing at rates higher than 2,000 lb/ft, and in some cases more than 3,000 lb/ft.
Proppant loadings in Q4 2016 boosted the average proppant per lateral foot in tight formations 50% to 1,740 lb year-over-year. Average proppant per lateral also soared in 2016, finishing up 72% to an average 14.56m pounds/lateral.
Combined with proppant loading has been the extension of lateral lengths drilled and number of stages per well, also positively influencing proppant consumption.
Laterals grew 14% in 2016, according to a Hart Energy survey. Horizontal drilling has gone past the previous standard of 1,372 metres (4,500 ft) per section, to average lateral lengths exceeding 2,530 metres (8,300 ft) by the end of 2016.
Stages per well rose 34% to an average of 41 across US shale plays in 2016. Spacing between stages, which extended more than 76 metres (250 ft) three years ago, now averages < 61 metres (200 ft).
There also has been a return to batch completions during the first months of 2017, ie. E&P companies fully completing wells. When the oil price fell there quickly became a backlog of drilled but uncompleted wells (DUC), these are now being addressed.
Register Now!
Early Bird Rate Ends 10 April 2017
Contact: Ismene ismene@imformed.com | T: +44 (0)7905 771 494
Mike,
The article is great . I am happy to see that the Energy world still controls the Geo politics. The world is still market driven and , oil industry is still the front runner.