Which mineral imports & markets are in line of US tariff fire?
The industrial minerals trading community will be steeling itself over the latest round of US trade tariffs brought to bear on Tuesday 4 March on Canada (25%), China (doubled to 20%) and Mexico (25%).
Going on the early form of this new US Administration anything is possible and further changes could arise in the next few weeks as trade deals may be brokered between the respective countries, …or not.
UPDATE: Within hours of this article being posted 6 March, President Trump announced a reduction of tariffs on potash not already covered under the United States-Mexico-Canada Agreement (USMCA; signed in his first term) from 25% to 10%. US Secretary of Agriculture Brooke Rollins described it as “… a critical step in helping farmers manage and secure key input costs at the height of planting season while reinforcing long-term agricultural trade relations.”
20 March: President Trump signed an Executive Order to boost US mineral production, streamline permitting, and enhance national security. “Minerals” covered by the order include critical minerals, uranium, copper, potash, gold, and any other element, compound, or material as determined by the Chair of the National Energy Dominance Council, such as coal. The White House statement commented: “The United States currently imports a significant portion of its minerals from foreign countries, creating economic and security risks, despite possessing a vast supply of critical minerals. A strong domestic mineral production industry would ensure US companies can compete globally without overly relying on foreign supply chains.”
2 April: President Trump’s sweeping announcement on so-called “reciprocal” tariff rises for all US imports, adds 34% to existing 20% duties on all Chinese imports to the US. Canada and Mexico import tariffs remain unchanged for now. China, the EU and Canada have vowed to retaliate, thus a trade war certainly appears in the offing.
Some goods will not be subject to the Reciprocal Tariff. These include articles already subject to Section 232 tariffs (steel, aluminium); copper, pharmaceuticals, semiconductors, and lumber articles; and energy and other certain minerals that are not available in the USA.
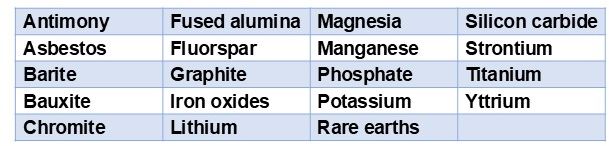
Annex II enumerates the other exempted products, including certain critical and industrial minerals, energy and energy products. These include the following industrial minerals as ores, oxides, and salts:
Industrial minerals imported by the USA that appear not to be exempt include: nepheline syenite (>95%; Canada), garnet (48%; South Africa, Australia, India, China), and those minerals with US import dependency of <40%: bromine, feldspar, perlite, salt, vermiculite, zircon.
Official White House: Annex II, Executive Order and Fact Sheet.
In any event, industrial mineral (ie. non-metallic, non-fuel) producers in Canada, China and Mexico, involved international traders, and crucially, US consumers of these commodities are now busy assessing what the future may hold for the security and cost of maintaining their existing and planned mineral trade flows.
Should the trade tariffs hold, then prices will certainly increase and impact US consumers.
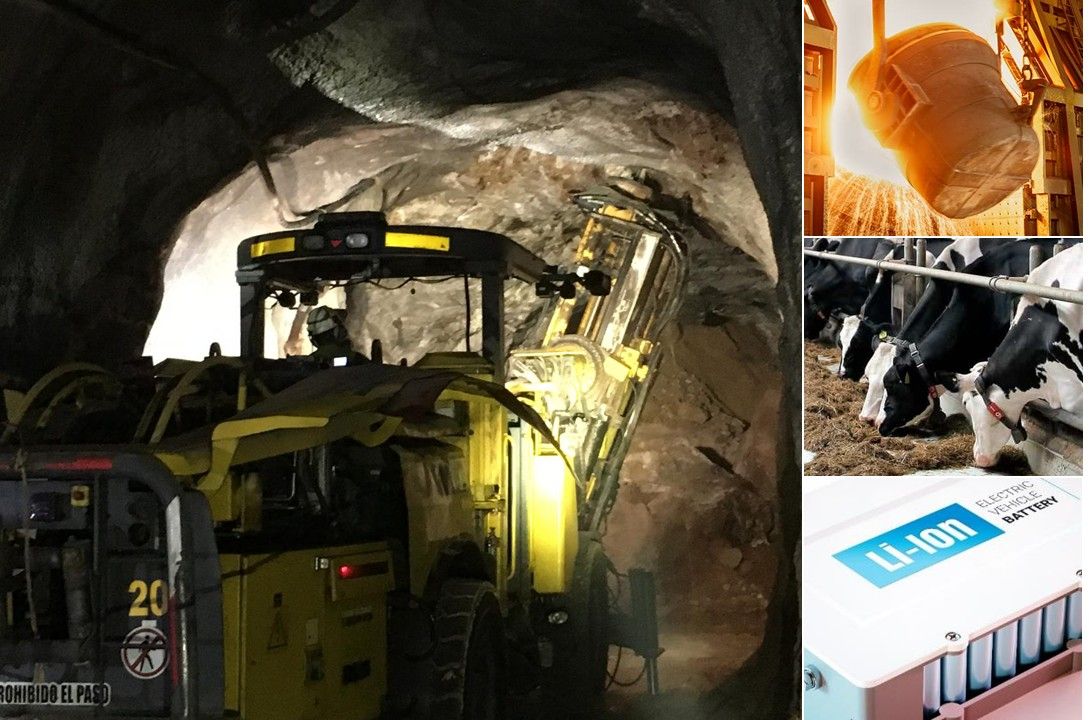
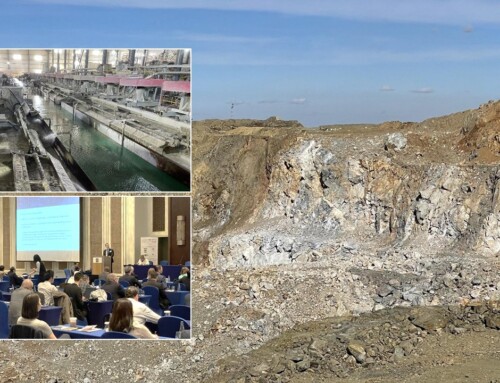
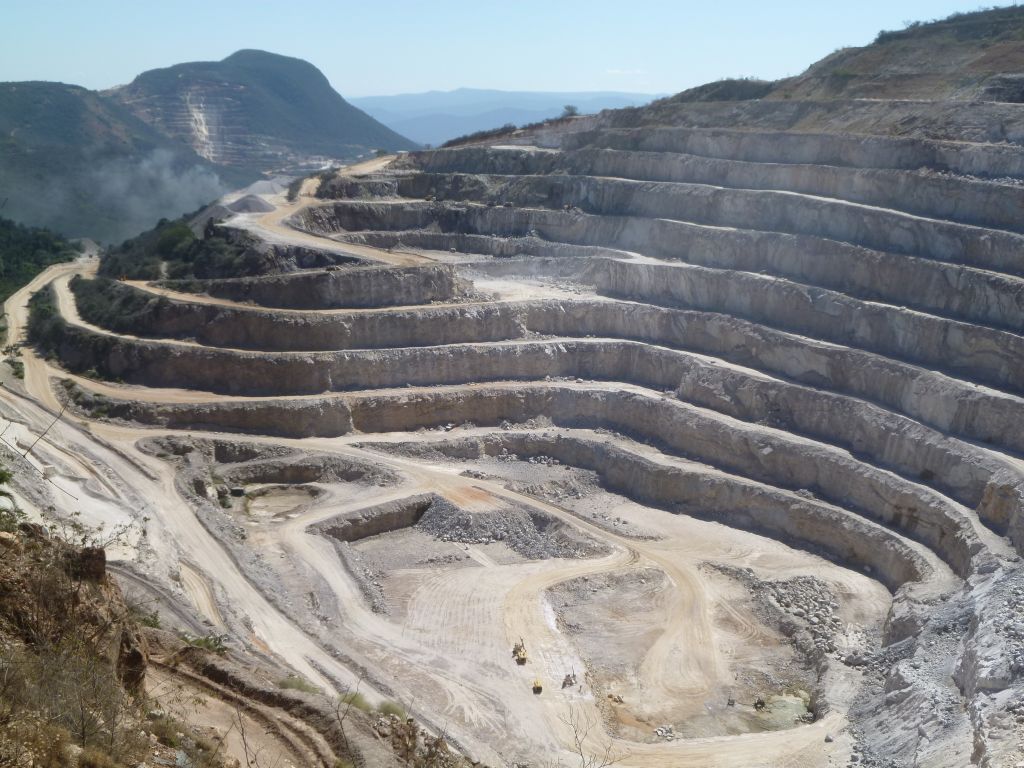
Title Image Tunnel Vision? Main image: Drilling underground at the world’s largest fluorspar mine Las Cuevas, near San Luis Potosi, Mexico operated by Koura Global; fluorspar is a designated critical mineral, of which the USA is 100% reliant on imports; Mexico accounts for 62% of US fluorspar imports, which are consumed in batteries, chemicals, electronics, and steelmaking, and now faces 25% US import tariffs; Inset images: US key markets such as steelmaking, agriculture, and batteries are all are heavily dependent on imports from Canada, China, and Mexico.
On 3 March, The Essential Minerals Association (EMA; the representative voice for US industrial mineral producers) released a statement encouraging the Trump Administration to “refrain from implementing tariffs on imports from Canada and Mexico” and seek alternative solutions.

“The unintended consequences this could have to our economy could be devastating.” Chris Greissing, EMA president.
The EMA statement warned: “tariffs would cause prices to rise steeply across the economy…many companies would see an increase in costs in the tens of millions of dollars per year, if not worse. The tariffs, instead of strengthening the domestic mineral supply chain, would cause US manufacturers to become more reliant on foreign sources, including from hostile nations.”
Canada is the largest source of US mineral imports, accounting for $47bn in 2023. According to the Center for Strategic and International Studies, “a 25 percent tariff on Canadian mineral imports could cost US off-takers an additional $11.75 billion.”
EMA believes tariffs between the North American markets has the potential to jeopardise national security and severely weaken the domestic supply chain and economy overall.
So it is instructive to take a brief look at which industrial minerals and markets in particular will be facing an uncertain future with regard to their trade and use in the USA.
Big picture: US has >50% import dependency on 24 industrial minerals
According to the latest US Geological Survey (USGS) data for 2024, the value contributed to the US GDP by major industries that consume (all) processed mineral materials amounted to US$4,080bn, that is almost 14% of US GDP. In 2024, US net imports of all processed mineral materials was US$77bn.
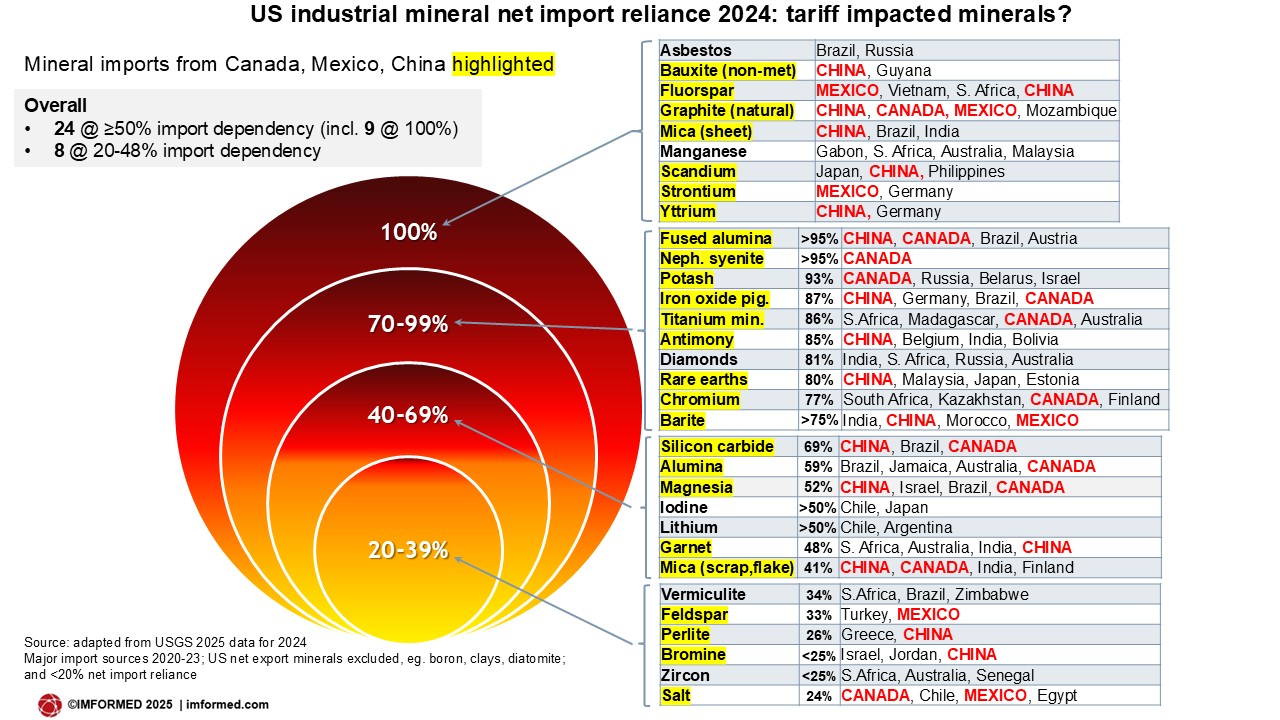
So which industrial minerals are key to the USA’s economy? The accompanying chart shows that the USA has a net import reliance of >50% on 24 different industrial minerals (of which 8 minerals the USA has 100% import reliance), and 20-48% dependency on a further 8 minerals, so, 32 minerals in total.
Significantly, of these minerals, 25 (78%) are sourced from Canada, China and Mexico, countries which are all now facing 20-25% import tariffs. These minerals are highlighted in the chart, along with their respective import source countries and overall net import reliance as a percentage.
Tariff targeted countries’ supply to US: specific mineral analysis
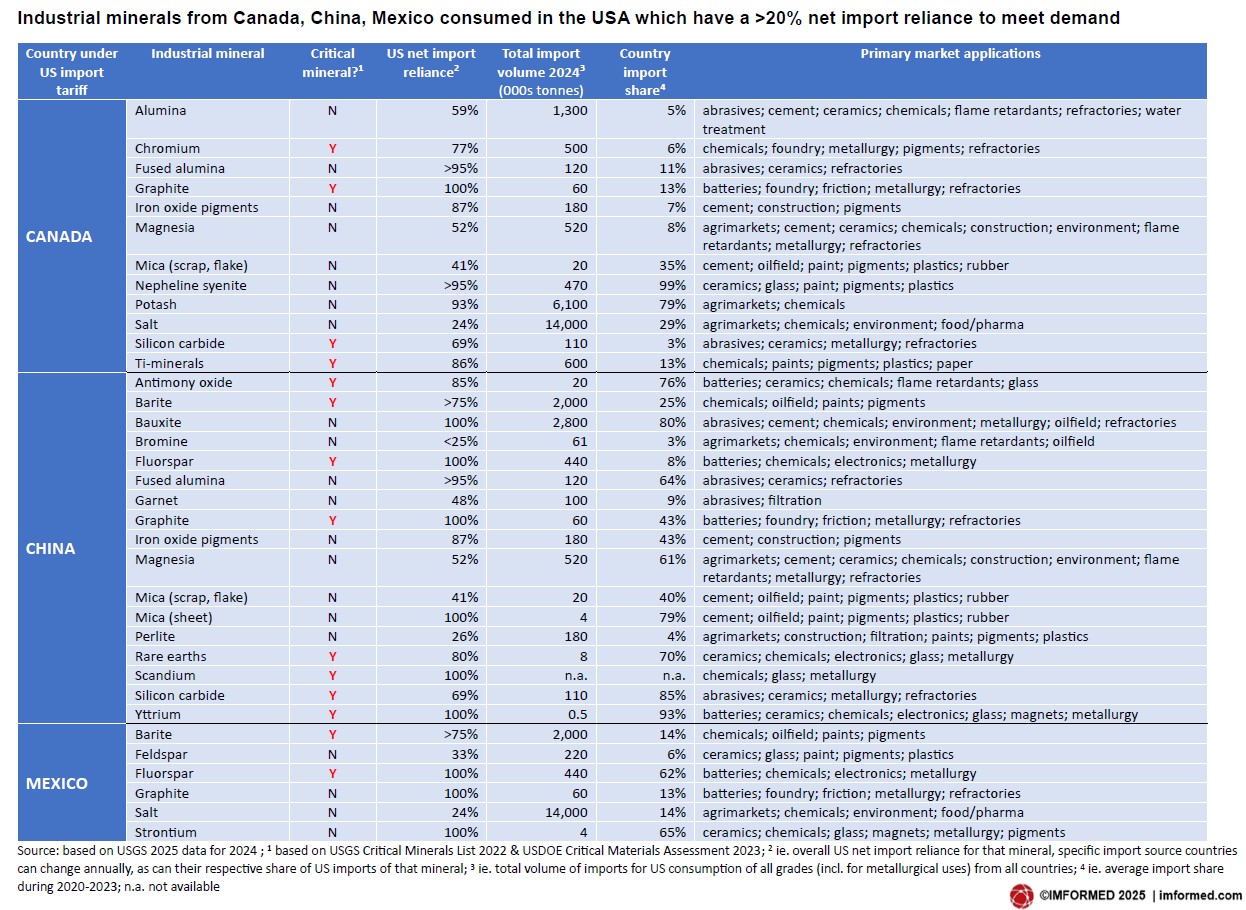
The accompanying table shows more detail on the specific industrial minerals sourced for US consumption from Canada, China, and Mexico:
- whether they are defined as a “Critical Mineral”
- their overall US net import reliance
- total import volume for 2024
- the respective country’s import share
- their primary market applications in the USA
This may make sober reading for US economists forecasting the fall out for domestic manufacturing sectors from this latest round of US trade tariffs.
Click here for a PDF download of these charts
Of critical minerals, Canada supplies 4, China, 8, and Mexico, 2 – quite a tally (10 different critical minerals in total).
More examination reveals that these include critical minerals with considerable supply contributions from the tariff targeted countries:
Antimony oxide: China, 76% (other major sources: Belgium, 11%; Bolivia, 6%).
Barite: China, 25%; Mexico, 14% (others: India, 40%; Morocco, 17%).
Fluorspar: Mexico, 62%; China, 8% (others: Vietnam, 14%; South Africa, 9%).
Graphite: China, 43%; Canada, 13%; Mexico, 13% (others: Mozambique, 13%).
Rare-earth compounds & metals: China, 70% (others: Malaysia, 13%; Japan, 6%; Estonia, 5%).
Silicon carbide: China, 85%; Canada, 3% (others: Brazil, 4%).
Titanium minerals: Canada, 13% (others: South Africa, 32%; Madagascar, 16%; Australia, 11%).
Yttrium: China, 93%.
Moreover, just to complete the picture on all possibilities: Trump announced earlier this year that he might also consider imposing 100% tariffs on the “BRICS+” countries. This would also then impact several of the other source countries for these critical and other minerals on which US has high import dependency:
Brazil: silicon carbide, plus fused alumina, magnesia, bauxite.
South Africa: fluorspar, chromite, plus zircon.
On 1 November 2024, Vietnam (plus Malaysia, Indonesia, Thailand) became partner countries of BRICS; Vietnam is a key fluorspar source for the USA.
Mike O’Driscoll presented “Fluorspar’s future in batteries: Can it achieve ‘critical mass’?” at the SME 2025 Annual Conference, Denver, 26 February – addressing the outlook for fluorine supply, impacted by recently “lost” production capacities, declining production in China, and trying to meet rising market demand, where will future supply come from?
Click here to access a free PDF download of the presentation
“Non-critical” minerals also have significance
It is also important to remind of the other industrial minerals from Canada, China and Mexico not officially designated (yet) as “critical”, though many US manufacturing sectors strongly rely on these imports:
Fused alumina: China, 64%, Canada 11% (others: Brazil, 7%; Austria, 5%).
Bauxite: China, 80% estimated refractory grade (others: Guyana, Brazil)
Magnesia:
Caustic calcined magnesia: China, 73%; Canada, 21%.
Dead burned & fused magnesia: China, 70% (Brazil, 18%; Turkey, 3%).
Magnesium hydroxide: Mexico, 59% (others: Netherlands, 14%; Israel, 13%; Japan, 5%).
Mica:
Scrap and flake: China, 40%; Canada, 35% (others: India, 9%; Finland, 5%).
Sheet: China, 79% (others: Brazil, 6%; India, 4%).
Nepheline syenite: Canada, 99%
Potash: Canada, 79% (others: Russia, 11%; Belarus, 4%; Israel, 3%).
Salt: Canada, 29%; Mexico, 14% (others: Chile, 27%; Egypt, 8%).
Strontium: Mexico, 65% (others: Germany, 30%).
These are all stand-out minerals much needed for US consumer sectors.
Fused alumina and bauxite are in high demand for refractory and abrasive manufacturing, with 70% fused alumina imported from China and Canada, and most refractory bauxite from China.
Likewise, all US demand for dead burned and fused magnesia essential for refractories must be imported, and mostly from China.
Caustic calcined magnesia and potash are essential to US agrimarkets, with caustic calcined magnesia serving the dairy cattle market, and potash mainly for US fertiliser production.
Magnesium hydroxide from Mexico is used in a range of markets including chemicals, water treatment, and flame retardants.
Mica and salt use in the USA is also highly dependent on China and Mexico imports. Salt markets are wide ranging, but the north-east US deicing market relies strongly on imports.
Strontium supply from Mexico is used in ceramics, chemicals, glass, magnets, metallurgy and pigments.
Should magnesite & magnesia be designated as Critical Minerals?
This topic will be under examination at IMFORMED’s upcoming MagForum 2025, Salvador, 19-21 May – EARLY BIRD RATES END 7 April
Magnesia market outlook: geopolitical trends & critical mineral status
Jessica Roberts, Research Director, Project Blue, UK
Mineral “Criticality” can change
Just going back to potash for a moment. Nothing better exemplifies the wise quote from Steven M. Fortier, former Director, USGS National Minerals Information Center, in announcing the latest US Critical Minerals List in 2022: “Mineral criticality is not static, but changes over time.”
That USGS list was updated from the 2018 USGS Critical Minerals List, and notably added nickel and zinc, but also removed helium, rhenium, strontium, and potash.
At that time, potash world production was 46.3m tonnes in 2021, of which Canada was the world’s no.1 producer (31%), but ranked 2nd and 3rd were Russia and Belarus, accounting for 20% and 16% of world production, respectively.
The USGS 2022 list was announced on 22 February 2022. On 24 February 2022, the Russian invasion of Ukraine commenced, launched out of Belarus to target Kyiv.
So in this case, geopolitics and conflict immediately changed the mineral availability situation for potash, unsurprisingly propelling it back into “critical” mode for some consumers.
Another observation to note is that the mineral import sources (ie. leading exporting countries) can also change, and influence mineral trade, as sources come and go. For example, Canada Fluorspar’s operation in St Lawrence, Newfoundland was mothballed in 2022, thereby immediately closing a significant fluorspar source to the USA (a planned restart is still awaited by the markets).
Ukraine’s “critical” minerals?
Actually, Ukraine does have some very significant resources and pre-war was a major supplier of certain key industrial minerals (ie. non-metallic minerals). While not in the now fashionable CRM regime of the likes of rare earths and lithium, these are nevertheless critical mineral supplies for European markets – we’re talking kaolin, ceramic clays, titanium minerals ilmenite & rutile, zircon, and refractory minerals graphite, kyanite, fused alumina, silicon carbide.
For more details & analysis please see our report (posted just after the invasion early 2022): “Industrial mineral supply disruption: Ukraine crisis“
Impact to US consuming markets
The last column of the table highlights the main market applications for these minerals and will be seen to include some very important sectors essential to the US economy.
Many of these markets are intermediate manufacturing sectors which are imperative for ultimate end markets.
Refractories and abrasives for example, are vital to help manufacture components used in defence and military uses (see The crucial role of industrial minerals in defence & national security), as well as their primary refractory use in all plants making steel, metals, glass, cement, ceramics, and petrochemicals.
Regarding the rapidly evolving Li-ion battery market, especially for EVs and municipal applications, fluorspar and graphite stand out as the critical minerals on which the USA relies 100% in imports from Canada, China and Mexico.
There are ongoing projects in the USA in trying to develop domestic sources for graphite and fluorspar but how soon they will come to fruition is unclear, and certainly not in time to ease these immediate import tariffs.
If anything, perhaps this latest round of trade tariffs may provide a boost for such US mineral development projects, but again, nothing is certain in these times.
How the US manufacturing sectors will absorb or pass on these cost increases for their required minerals is top of the agenda, as is the consideration of future exports to the US by producing companies in Canada, China and Mexico. Perhaps, as has happened in the recent past, certain industries may be able to successfully lobby the US Government to exempt their minerals from the tariff list.
Meanwhile, this whole issue may also prompt US mineral consumers to start seeking alternative sources of overseas mineral supply from non-tariff targeted countries, and even start to consider switching to using alternative/recycled minerals from domestic sources. Let’s see.
Don’t miss the latest trends & developments at…
![]()
![]()
Great article. I fear same bad economicals will soon pop up in all EU countries and UK. Europe is so depending from China controlled minerals and REE, for which no easy or fast alternatieve ex-China or domestic source is available. Very complex and gloomy outlook
Super Thank you